Submerged Arc Welding (SAW) Principle and Uses

0 comments
Submerged Arc Welding  or SAW  is one of the most occurring  arc welding process. It needs a electrode which may be solid of tubular. The electrode should be used in a continuous approach. It should be fed continuously. Ohhh ... for your kind information tubular electrode is the one which is flux shielded.

The main feature of this welding is that – The weld and the arc area is protected from environmental contamination by the application of a granular flux which is fusible. The weld pool is protected by a blanket of flux. So that area is actually submerged under that flux. When temperature rises and molten the flux becomes  conductive. And thus this creates a path for electron flow between electrode and workpiece. SAW or Submerged Arc welding can be done by manual procedure or automatic process. But it can be done by semi-automatic process where welding gun is hold by hand. Here pressurized gravity flux feed is given.  

Both DC and AC can be used as power supply. In multiple electrode system DC – AC combination is very common. Constant voltage power supply machines are used very frequently.

Advantages 

  • This welding process has high deposit rate. Almost 45kg/h can be deposited. 
  • In mechanized applications. 
  • Very little welding fume is seen . . 
  • No edge preparation is needed. 
  • This process is applicable indoor as well as outdoor.  
  • No chance of weld spatter as it is submerged in flux blanket. 


Disadvantages


  • Operation is limited to some specific metals. 
  • The application is limited to straight seams and pipes and vessels. 
  • The flux handling can be tough. 
  • Health issue can be caused because of the flux. 
  • Slag removal is needed after welding. 


Applications


  • Joining of pressure vessels such as boilers. 
  • Many structural shapes, earth moving equipment, pipes. 
  • Railroad construction, locomotives and ship building. 
  • Repairing machine parts. 
Read :


Read full post »

Gas Tungsten Arc Welding (GTAW) or Tungsten Inert Gas (TIG) Welding

1 comments
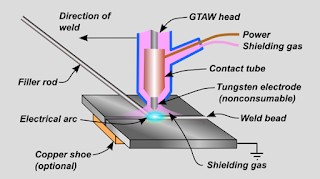
Gas tungsten arc welding  or GTAW  is the same as tungsten inert gas  or TIG  welding. It  is also an arc welding process. Here a non-consumable electrode is used. And most importantly - the electrode is made of  tungsten. And this electrode helps to produce the weld. The weld area is protected from atmospheric contamination or oxidation by usually an inert gas. This shielding gas is generally argon. Autogenous welds are not required in this process.
Here energy is supplied by a constant current welding power source. This power supply produces energy which is conducted through a column of ionized gas accompanied by metal vapors. These are known as plasma.

If this welding is done manually then it is one of the most complex welding processes. This process is difficult in industrial level because the welder has to maintain a short arc length. Great skill and care is needed to conduct the operation without any contact between electrode and workpiece. In GTAW the welder has to use both the hands. Welder has to put the filler metal manually and also maintain the torch. Some materials can be welded without the filler metal (autogenous or fusion).

Gas tungsten arc welding (GTAW)


Advantages of GTAW


  • No flux is used
  • No danger of flux entrapment when the welding of refrigerator or air conditioner takes place. 
  •  Better control by the operator because of better visibility. 
  • Very few splatters. Very high quality and smooth welds. 


Disadvantages of GTAW


  • Under similiar conditions MIG welding is much more faster process. 
  • Tungsten if gone to the molten weld then it can contaminate the pool. 
  • Equipments  are costly. 

Applications


  • Aluminium, magnesium, copper alloys can be welded easily. Inconel, carbon steels, stainless steels can be welded. 
  • Thin parts and sheet metals can be welded easily. 
  • Can sealing, instrument diaphragms and transistor cases can be welded very efficiently. 
  • Expansion bellows and other delicate parts can joined. 
  • Atomic energy, aircraft, chemical and instrument industries use this welding process. 
  • Rocket motor chamber fabrication welding can be done by this process. 
Read :
Read full post »

Natural and synthetic molding sand and Properties of molding sand

3 comments

According to the amount of clayey matter they contain, the molding sands are classified as:

1.       Silica Sand:
2.       Lean or weak sand :
3.       Moderately strong sand :
4.       Strong sand :
5.       Extra Strong sand (Loam sand) :


Sand casting

Natural / green sand for casting :


Natural sand is the one which is available from natural deposits. Only additives and water need be added to it to make it satisfactory for molding.
The clay content of most natural sands is slightly higher than desired so that new sand can be continuously added to the used sand to replenish that which is 


Natural sand or green sand

Synthetic sand for casting :


A synthetic sand is prepared by mixing a relatively clay free sand having specified type of sand grain, with specified type of clay binder as well as water and other additives.           

Advantages of Synthetic molding sand :


1.       Low san maintenance cost
2.       Improper permeability
3.       Lower moisture
4.       Easier to work on mass production of molding
5.       Semi skilled workers can work on machine molding
6.       No sand damping


Properties of molding sand:

The success of the casting process depends to a large extent on the making of a satisfactory mould. For this, the molding properties of the sand have to be controlled.
These properties include:

(i) Porosity or Permeability
(ii) Strength or cohesiveness,
(iii) Refractoriness, 
(iv) Plasticity, 
(v) Collapsibility and 
(vi) Adhesiveness 
(vii) Co-efficient of expansion etc.

Refractoriness:


It is the ability of the molding sand mixture to withstand the heat of melt without showing any signs of softening or fusion.
This property is greatly influenced by the purity of the sand particles and their size.
It increases with the grain size of sand and its content and with the diminished amount of impurities and silt.

Permeability:


Permeability or porosity of the molding sand is the measure of its ability to permit air to flow through it.
Molten metal always contains a certain amount of dissolved gases which try to leave it when the metal solidifies. If all these gases and vapors are not able to escape completely through the walls of the mould, they may penetrate the liquid metal where, after solidification, they form gas holes and pores. To avoid these defects, the molding sand should have good gas permeability.
Again, higher the silt contents of sand, the lower its gas permeability. If the mould is rammed too hand, its permeability will decrease and vice versa.

Cohesiveness:


It is defined as the property of holding together of sand grains. Molding sand should have ample strength so that the mould does not collapse or get partially destroyed during conveying, turning over or closing.
This property also enables the pattern to be removed without breaking the mould and to stand, the flow of molten metal when it rushes inside the mould.
The strength of the molding sand grows with density, clay content of the mix and decreased size of sand grains. So, it is clear that as the strength of the molding sand increases, its porosity decreases;

Adhesiveness:


This is the property of sand mixture to adhere to another body (here, the molding flasks). The molding sand should cling to the sides of the molding boxes so that it does not fall out when the flasks are lifted and turned over.
This property depends on the type and amount of binder used in the sand mix.

Plasticity or flow-ability:


It is the measure of the molding sand to flow around and over a pattern during ramming and to uniformly fill the flask. This property may be enhanced by adding clay and water to the silica sand.

Please Read :


Read full post »

Types of patterns used in Casting Process

36 comments

Types of patterns:


The following factors affect the choice of a pattern.
(i)  Number of Castings to be produced.
(ii)  Size and complexity of the shape and size of casting
(iii)  Type of molding and castings method to be used.
(iv)  Machining operation
(v)  Characteristics of castings

Different types of patterns:


The common types of patterns are:

1)  Single piece pattern
2)  Split piece pattern
3)  Loose piece pattern
4)  Gated pattern
5)  Match pattern
6)  Sweep pattern
7)  Cope and drag pattern
8)  Skeleton pattern
9)  Shell pattern
10)  Follow board pattern


Single piece, Split, Match-plate, Cope and Drag Pattern

Figure 1: Single piece, Split, Match-plate, Cope and Drag Pattern

Single piece pattern:


This is the simplest type of pattern, exactly like the desired casting. For making a mould, the pattern is accommodated either in cope or drag.
Used for producing a few large castings, for example, stuffing box of steam engine.

Split pattern:


These patterns are split along the parting plane (which may be flat or irregular surface) to facilitate the extraction of the patternout of the mould before the pouring operation. For a more complex casting, the pattern may be split in more than two parts.

Loose piece pattern:


When a one piece solid pattern has projections or back drafts which lie above or below the parting plane, it is impossible to with drawit from the mould. With such patterns, the projections are made with the help of loose pieces. One drawback of loose feces is that their shifting is possible during ramming.

Loose piece pattern

Figure: Loose piece pattern

Gated pattern:

A gated pattern is simply one or more loose patterns having attached gates and runners.
Because of their higher cost, these patterns are used  for producing small castings in mass production systems and on molding machines.

Gated pattern


Figure: Gated pattern

Match plate pattern:


A match plate pattern is a split pattern having the cope and drags portions mounted on opposite sides of a plate (usually metallic), called the "match plate" that conforms to the contour of the parting surface.
The gates and runners are also mounted on the match plate, so that very little hand work is required. This results in higher productivity. This type of pattern is used for a large number of castings.
Piston rings of I.C. engines are produced by this process.

Please Read : Match - Plate Pattern complete guide with diagram.

Sweep pattern:


A sweep is a section or board (wooden) of proper contour that is rotated about one edge to shape mould cavities having shapes of rotational symmetry. This type of pattern is used when a casting of large size is to be produced in a short time. Large kettles of C.I. are made by sweep patterns.


Figure: Sweep pattern


Cope and drag pattern:


A cope and drag pattern is a split pattern having thecope and drag portions each mounted on separate match plates. These patterns  are used when in the production of large castings; the complete moulds are  too heavy and unwieldy to be handled by a single worker.

Skeleton pattern:


For large castings having simple geometrical shapes, skeleton patterns are used. Just like sweep patterns, these are simple wooden frames that outline the shape of the part to be cast and are also used as guides by the molder in the hand shaping of the mould.
This type of pattern is also used in pit or floor molding process.

Skeleton pattern

Figure: Skeleton pattern

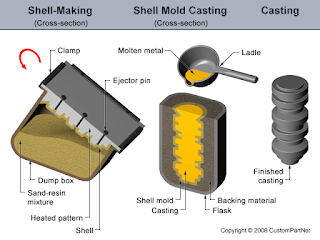
Shell pattern:


Figure: Shell pattern

Follow board pattern:


A follow board is not a pattern but is a device (wooden board) used for various purposes.

follow board pattern

Figure : Follow board pattern

Please read : 
Comparison of Casting processes 
Advantages and Disadvantages of Centrifugal casting process
Type of molding sand in casting process
Natural and synthetic sand properties for molding process
Different types of casting defects 
Different Types of Welding Defects
Different Sand Casting Process

Read full post »

Dimensional analysis - Methods of Dimensional analysis

4 comments

Dimensional analysis :

dimensional analysis

Dimensional analysis deals with the dimensions of physical quantities. Dimensional analysis reduces the number of variables in a fluid phenomenon by combining the some variables to form non dimensional parameters. Instead of observing the effect of individual parameters the effect of non-dimensional parameters are studied. All physical phenomena is expressed in terms of a set of basic or fundamental dimensions. In fluid mechanics mass (m), length (L), and time (T) or force (F), length (L) and time (T) are considered as fundamental quantities. These two systems are known as MLT system and FLT system. These systems of dimensions are related to Newton's second law of motion i.e. Force = mass x acceleration or

F = M x L/T2  

Other physical quantities can be expressed by this quantities.  


Advantages of  dimensional analysis


There are a lot of advantages of Dimensional analysis and similitude.
  • By dimensional analysis number of experiments can be reduced. 
  • Dimensional analysis help us to do experiments in air or water and then applying the results to a fluid which is less convenient to work with. Such as gas, steam or oil. 
  • Cost can be reduced by doing experiments with the models of full size operations. Performance of the prototype can be determined from the test models. 
  • Models can be used for the design of ships, Airplanes, pumps , turbines, dams, river channels, rockets  and missiles etc.  Model can bigger, smaller or of the same size of the prototypes. 

Methods of Dimensional analysis

The number of dimensional variables can be reduced into a smaller number of dimensionless parameters by several methods. Commonly used two types of methods are  

i ) Rayleigh's Method 
ii ) Buckingham Pi Method

Rayleigh's method 


This method was proposed by Lord Rayleigh in 1889. In this method a functional relationship is expressed in an exponential form which is dimensionally homogeneous. For exmaple , if A1 is a dependent variable and A2, A3 A4  …………… An are independent variables in a phenomenon, the functional equation can be written as 

A1  = f (A2, A3 A4  …………… An)

This equalition can be written in the exponential form using powers a,b,c .........n as 

A1 = K[ A2a A3b A4c  …………… Ann ]

where K is a dimensionless constant. Now the dimensions of the each of the quantities A1, A2, A3 , A4  …………… An are written and the sum of the exponents of fundamental quantities on both sides are equated. After solution of the equations the values ofa , b, c, .... are found out and these values are substituted in the main equation. From the new main equation, after simplification yields dimensionless groups controlling the phenomenon. However, when a large number of parameters are involved this method becomes complicated. 


Buckingham Pi Theorem 


According to this theorem if there are n dimensional variables in a dimensionally homogeneous equation described by m fundamental dimensions they may be grouped in (n-m) dimensionless groups. Buckingham referred to this dimensionless groups as Pi groups. The advantage of this theorem  is that one can predict the number of dimensionless groups are to be expected. For the application of this method, m number of repeating variables are selected and dimensionless groups are obtained by each one of the remaining variables one at a time. Generally, a geometric property (such as length), a fluid property (such as mass density) and a flow characterstics (such as velocity) are generally most suitable as repeating variables.   

Read : 

Read full post »

The burnout effect on boiling

0 comments

The burnout phenomenon in boiling can be expressed like this
Before that please read 

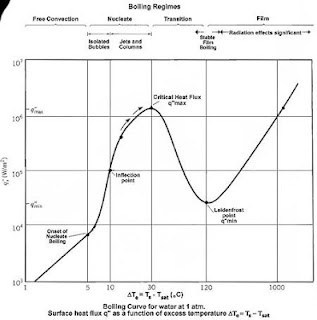
In the Nucleate boiling region we saw the critical heat flux or the maximum heat flux. And we want more heat transfer and thus we have to heat the liquid further. But due to the some vapor covering the liquid cannot receive that heat as result the heater surface has to absorb the heat. This increase energy with increased excess temperature is absorbed by the heater surface. And further increase in the surface temperature causes the surface to leave that heat. It cannot take any more heat. But most of the time the heater surface cannot come to the position to leave it. Before that it melts. This is called burnout phenomenon. That’s why critical heat flux is called burnout heat flux. Most of the boiling heat transfer heaters are operated below the burnout heat flux to avoid that disastrous effect. High melting point metals can solve this problem. But in case of cryogenic application the burnout is not a problem. 

The burnout phenomenon

the boiling curve for water

Pleas Read : 


Read full post »

Different Boiling Regimes and boiling curve

6 comments
Boiling is a great means of heath transfer. Though it is a very much familiar form of heat transfer, its mechanism is still very confusing. The most important inventions in the field of boiling was done by S. Nukiama in 1934.

boiling curve for water

Different boiling regimes 


Four boiling regimes are seen in the boiling curve. These are 

  • Natural convection regime
  • Nucleate regime 
  • Transition regime and 
  • Film boiling regime 

Natural convection boiling 


Boiling starts when the fluid come into its saturation temperature. But actually it needs some more temp. to boiling to be started. For water this temperature is about 2 to 6 degrees. At that condition we start to see the bubbles forming. In the natural convection boiling we start to see the bubbles to form. Bubbles are an indispensable part of boiling. No needs telling that in this region all the heat transfer is by natural convection currents. This stage happens when the fluid is slightly superheated  (metastable).


Nucleate boiling


This is the most desirable part of boiling heat transfer. In this part we can see the regions. At this part bubbles start to form in different nucleation sites. These bubbles are formed and in the first region they are most likely to collapse when they leave the heater surface. These are isolated bubbles. There is a significant increase in the rate of bubble formation. When bubbles leave the surface they collapse and the space vacated is filled by the surrounding liquid and thus heat transfer is accelerated.  
After taking a lot of heat the bubbles are big enough and they rise to the top surface. These bubbles are energy movers. Thus we can see a significant increase in the boiling curve with the excess temperature. In this region they form continuous columns of bubbles. Here we find the highest heat flux or critical heat flux or the burning heat flux. This point is also called the burning point or critical heat flux.

Transition boiling


It is a very much undesired and unstable part of boiling. In this stage we can see a huge drop of heat flux. The reason behind this is the vapor blanket. Liquids take too much heat and they form huge amount of vapor that cause the formation of vapor blanket or vapor cover. Thus the surrounding liquids find it hard to get into the heater surface. That’s why we see the significant heat flux drop. Here the heat transfer rate decreases.

Film boiling


Here is the interesting part. Here we see that heat transfer increases. After getting the critical heat flux and then a decrease in the transition boiling the heater surface absorbs heat. And after sometimes it leaves the heat into the liquid and the heat is very massive that radiation heat transfer comes in handy. That’s why we see an increase in the heat flux. At the first part part of this region we see a minimum flux and that is called Leidenfrost point or the minimum heat flux point. In this part the burnout phenomenon can occur very frequently.
Read full post »

How to read Moody Diagram

0 comments
In fluid dynamics we have to solve problems which involves the use of Darcy-Weisbach friction factor f. Whether the flow is steady or transient we have to use it. If you try to solve this factor directly , much complexity is experienced. For circular pipes the problems can be solved using Swamee- Jain equation but for the other types it is really difficult. in these cases Moody diagram or Moody charts are really handy. 


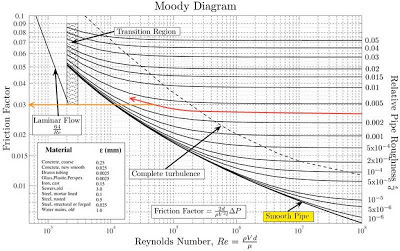
Moody diagram


How to read the Moody chart 


1. Most of the fluid mechanics problems involve the determination of Reynolds number. Once Reynolds number is known we can use the chart easily. If there is no velocity given then we have to assume a velocity or an initial friction factor. Say you have chosen an initial friction factor then move to step 10. If your assumption is correct then you will get the same answer. 

2. If the Reynolds number shows that the flow is laminar then we need to use Moody chart. But if the flow is turbulent then we have to look through the Moody chart. 

3. At first you have to calculate the relative roughness of the pipe. Relative roughness is gained by dividing the roughness of the pipe with that pipe's diameter. Relative roughness have to dimensionless so diameter and roughness should be in the same unit. 

4. If the actual or wall roughness is zero then relative roughness will also be zero. But you will always get value for the friction factor. 

5. Get the line which matches your relative roughness on the right side of the chart. If you don't get a printed line available then assume a line parallel to nearest match of that relative roughness. You can take a pencil a draw one for ease of using.  

6. Now follow your line to the left as it curves up and reach the line (vertical) corresponding to your previously determined Reynolds number. 

7. Remember that point by marking. 

8. Use a scale and follow that point to left parallel to x axis. 

9. From the far left of the chart read your desired friction factor. 

10. Now you can get the energy loss after getting the friction factor. 

11. With this you can calculate a new velocity and then Reynolds number. 

12. Compare the new and previous values of Reynolds number and see if the values are acceptable or not. If the difference is negligible then repeat the calculation with the new Reynolds number. If the answer is well close then process will not become cumbersome. 

An Example for your understanding the Moody chart 

Say we are calculating a Reynolds number having value of 4x10^4 . This Reynolds number indicates the Turbulent flow. So lets get into the Moody chart. Select a relative roughness 0.003. Now follow the image. Follow the curve contours in the left. We have to follow this line our Reynolds number from before. You have to mark that point. Go straight to left as you see the orange line. We got the value 0.003. Now we can compute a new velocity and Re. Number. We have iterate if needed. 


How to read Moody chart


Remember 

  • Here all the parameters are dimensionless. So moody chart is applicable in everywhere. 
  • Interpolation error is common. Try to avoid that while taking the reading. 
  • This system will work only if we are considering steady flow. 

Read full post »
 

Copyright © Mechanical Engineering Design by Free CSS Templates | Blogger Theme by BTDesigner | Powered by Blogger