In fluid dynamics we have to solve problems which involves the use of Darcy-Weisbach friction factor f. Whether the flow is steady or transient we have to use it. If you try to solve this factor directly , much complexity is experienced. For circular pipes the problems can be solved using Swamee- Jain equation but for the other types it is really difficult. in these cases Moody diagram or Moody charts are really handy.


How to read the Moody chart
1. Most of the fluid mechanics problems involve the determination of Reynolds number. Once Reynolds number is known we can use the chart easily. If there is no velocity given then we have to assume a velocity or an initial friction factor. Say you have chosen an initial friction factor then move to step 10. If your assumption is correct then you will get the same answer.
2. If the Reynolds number shows that the flow is laminar then we need to use Moody chart. But if the flow is turbulent then we have to look through the Moody chart.
3. At first you have to calculate the relative roughness of the pipe. Relative roughness is gained by dividing the roughness of the pipe with that pipe's diameter. Relative roughness have to dimensionless so diameter and roughness should be in the same unit.
4. If the actual or wall roughness is zero then relative roughness will also be zero. But you will always get value for the friction factor.
5. Get the line which matches your relative roughness on the right side of the chart. If you don't get a printed line available then assume a line parallel to nearest match of that relative roughness. You can take a pencil a draw one for ease of using.
6. Now follow your line to the left as it curves up and reach the line (vertical) corresponding to your previously determined Reynolds number.
7. Remember that point by marking.
7. Remember that point by marking.
8. Use a scale and follow that point to left parallel to x axis.
9. From the far left of the chart read your desired friction factor.
10. Now you can get the energy loss after getting the friction factor.
11. With this you can calculate a new velocity and then Reynolds number.
12. Compare the new and previous values of Reynolds number and see if the values are acceptable or not. If the difference is negligible then repeat the calculation with the new Reynolds number. If the answer is well close then process will not become cumbersome.
An Example for your understanding the Moody chart
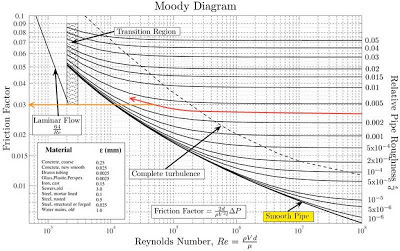
Say we are calculating a Reynolds number having value of 4x10^4 . This Reynolds number indicates the Turbulent flow. So lets get into the Moody chart. Select a relative roughness 0.003. Now follow the image. Follow the curve contours in the left. We have to follow this line our Reynolds number from before. You have to mark that point. Go straight to left as you see the orange line. We got the value 0.003. Now we can compute a new velocity and Re. Number. We have iterate if needed.

Remember
- Here all the parameters are dimensionless. So moody chart is applicable in everywhere.
- Interpolation error is common. Try to avoid that while taking the reading.
- This system will work only if we are considering steady flow.
For solving practical fluid mechanics problem using Moody diagram , see this post .
- How to solve fluid mechanics problems by moody chart
- Newton's law of viscosity
- Methods of Dimensional analysis in fluid mechanics
- Importance of fluid Mechanics for engineers and physicists
- Fluid and some of its properties
- A Complete Guide to Fluid Mechanics


Really great point to share our business is Interior Designs In Chennai & Modular Kitchen in Chennai Region. You need any from my end. Plz Contact.
ReplyDeleteTo study Mechanical related topics you have to visit here: http://crbtech.in/CAD-CAM-Training/
ReplyDeleteHere you will get all topics and information regarding mechanical engineering, cad cam technology, cae and autocad.
To study Mechanical related topics you have to visit here: http://crbtech.in/CAD-CAM-Training/
ReplyDeleteHere you will get all topics and information regarding mechanical engineering, cad cam technology, cae and autocad.
To study Mechanical related topics you have to visit here: http://crbtech.in/CAD-CAM-Training/
ReplyDeleteHere you will get all topics and information regarding mechanical engineering, cad cam technology, cae and autocad.
" This weblog is excellent i really like studying your posts.Keep up the good work! You already know, lots of individuals are hunting around for this information, you can aid them greatly. To study Mechanical related topics you have to visit here: http://crbtech.in/CAD-CAM-Training/
ReplyDeleteHere you will get all topics and information regarding mechanical engineering, cad cam technology, cae and autocad.
"
To study Mechanical related topics you have to visit here: http://crbtech.in/CAD-CAM-Training/
ReplyDeleteHere you will get all topics and information regarding mechanical engineering, cad cam technology, cae and autocad.